Performance Cockpit
Analytics Dashboards
The Analytics Dashboards application is bringing together the best from two worlds, data analytics and insights powered by the latest visualizations.
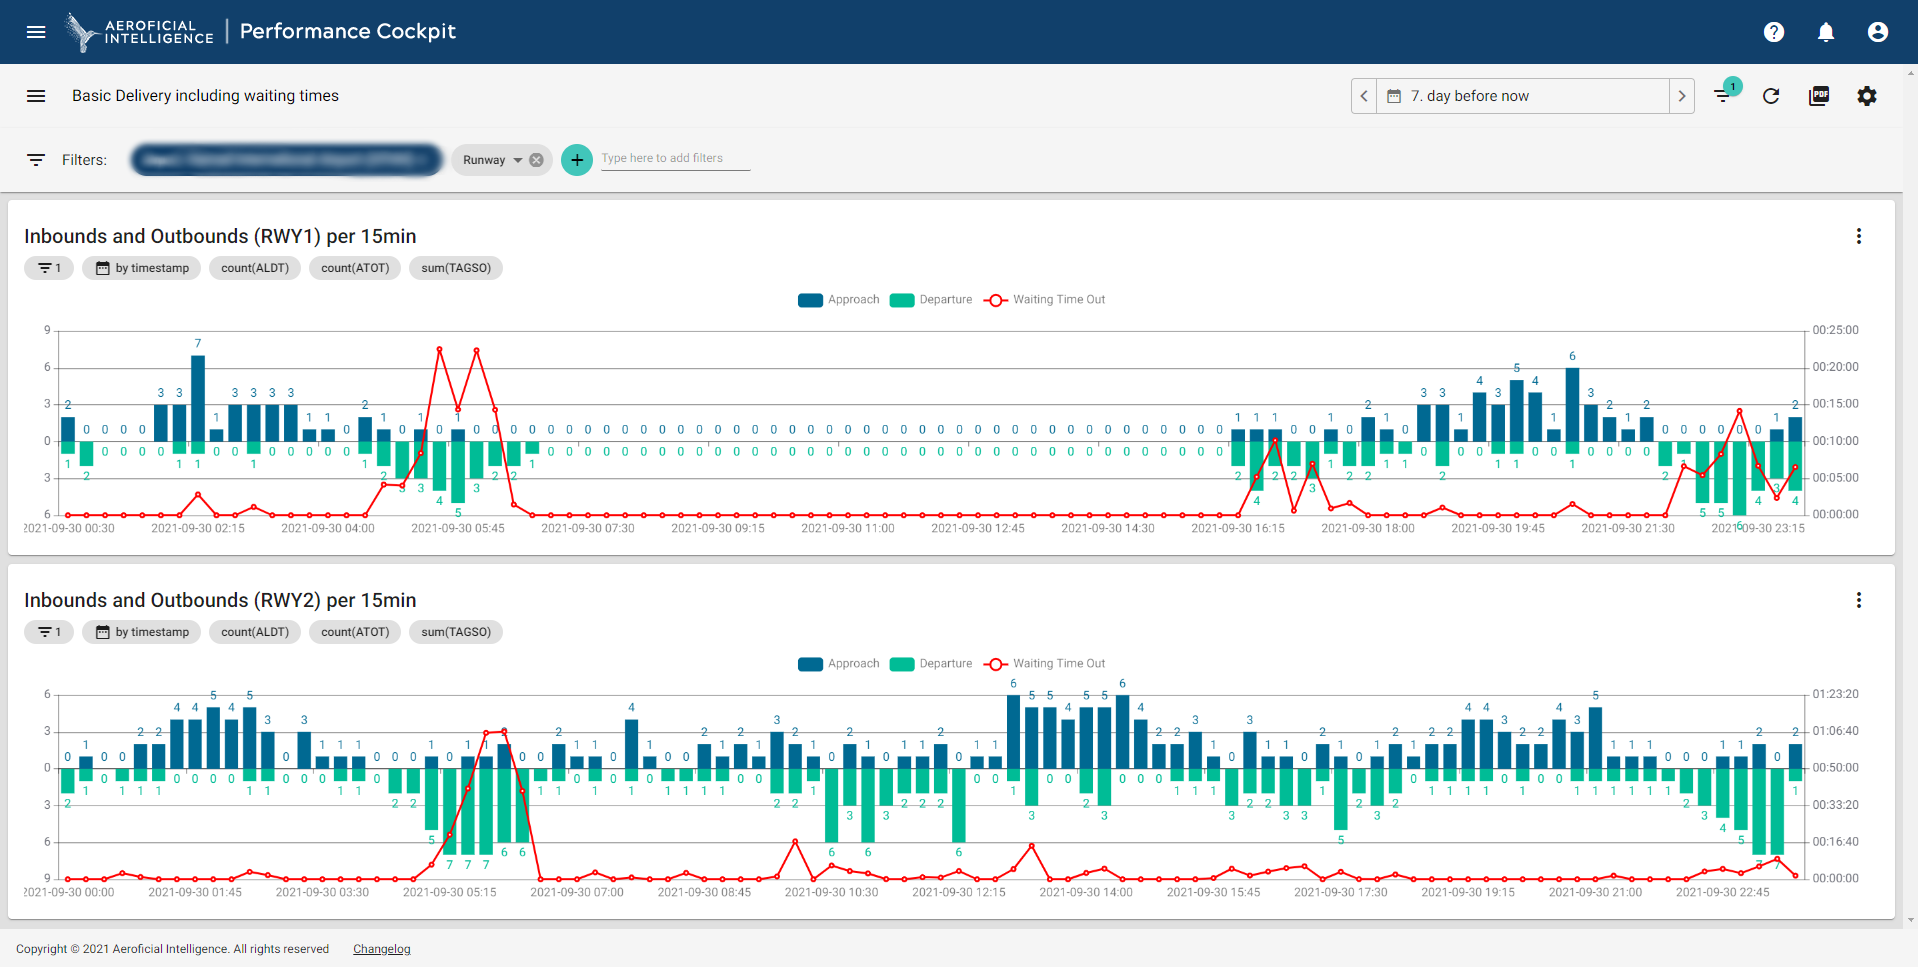
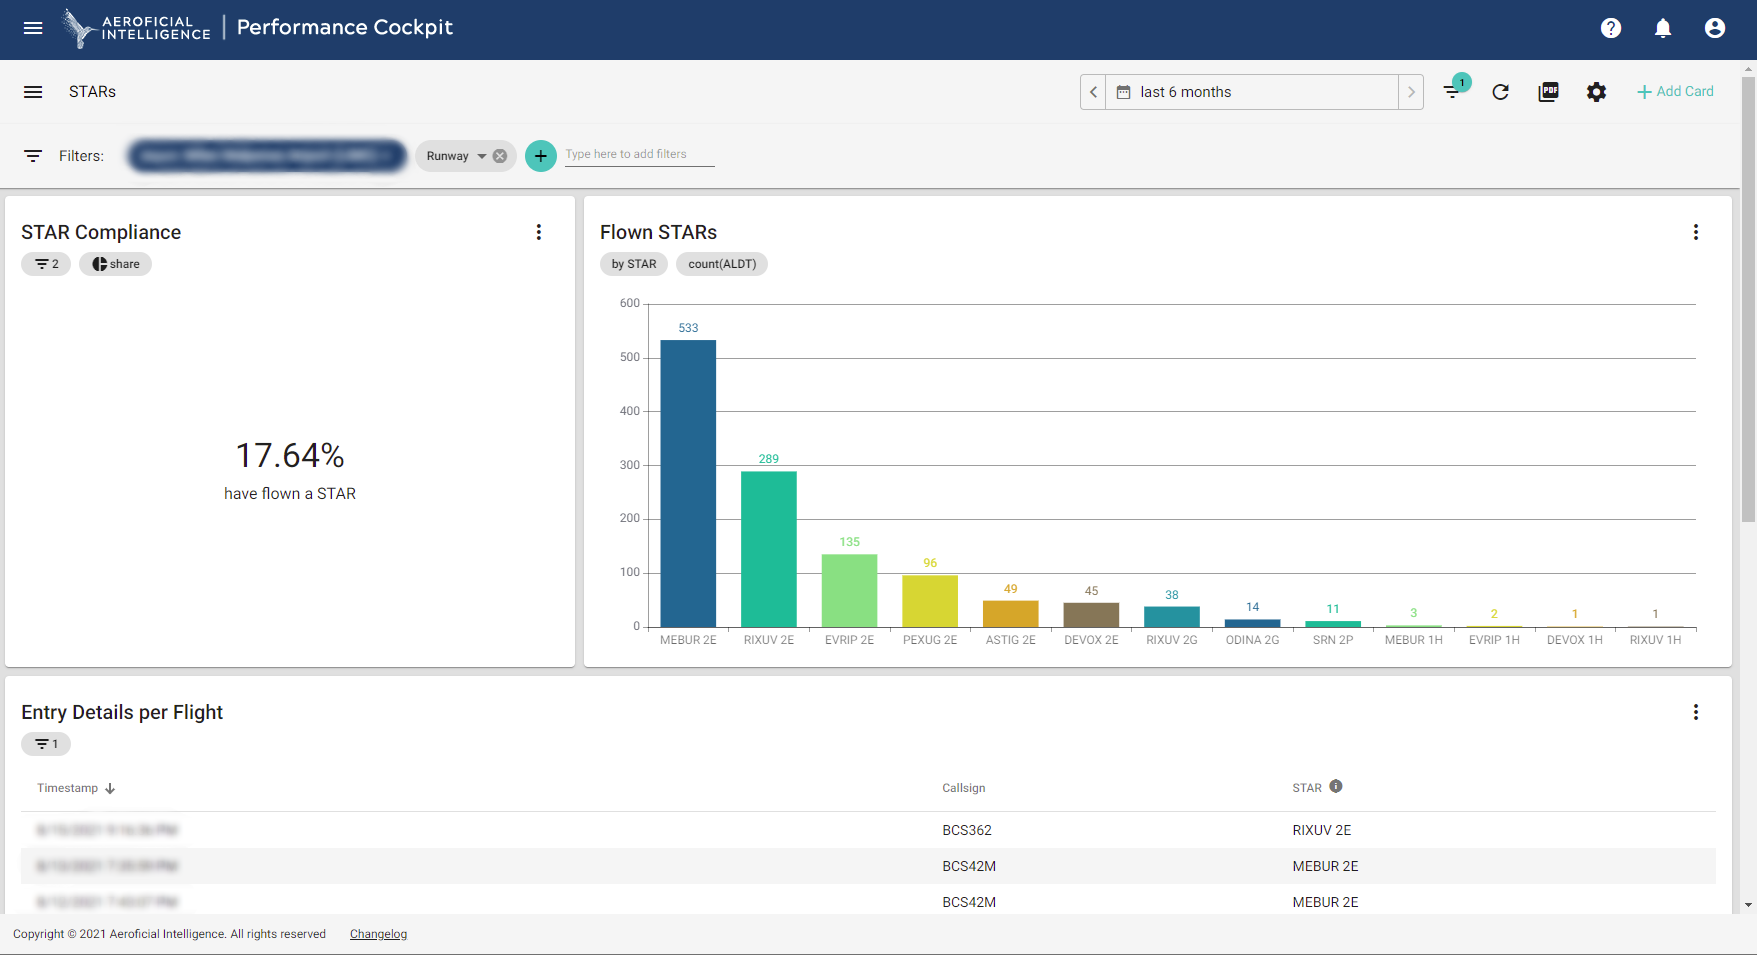
Monitor and evaluate operational measures that influence the on-time performance, traffic flows, throughput or occupancy of runways, taxiways, or gate positions. KPI dashboards provide customized reporting and insights as needed. Extensive filtering of data is available for each dashboard. This data can be presented as charts, tables or GANTT visualizations.
Benefits
- Wide range of insights
- Fully customized dashboards
- Access to 100+ KPIs
- Reporting engine
- Data exports
Features
- Lists/tables
- Bar chart
- Series (time, etc.)
- Boxplot
- Number card
- Trends
- Line chart
- Scatter chart
- Graph chart
- Pie chart
- Maps